These are some of the findings we found from our survey:
These are the findings from our transport part of the survey that we find most important and valuable.
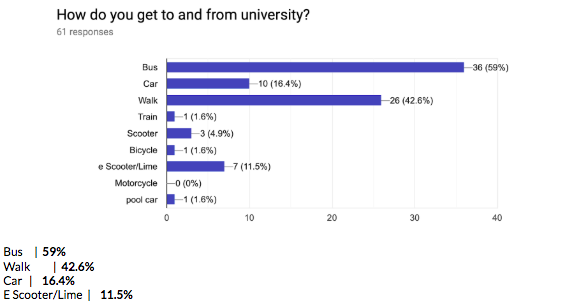
In these results we can see that more people (59%) take the bus to universtiy. Suprisingly walking is the second most popular with 42.6% walking to university. This helps us to understand that it is possible to walk to university from these areas.
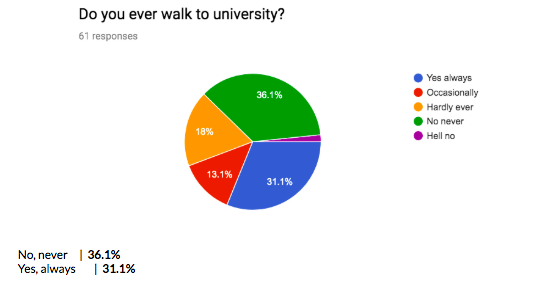
This survey question asked about the amount that someone would walk to university. No never was the most popular (36.1%). This shows us that most people do not walk to university and there is an opportunity to get more people to walk to university.
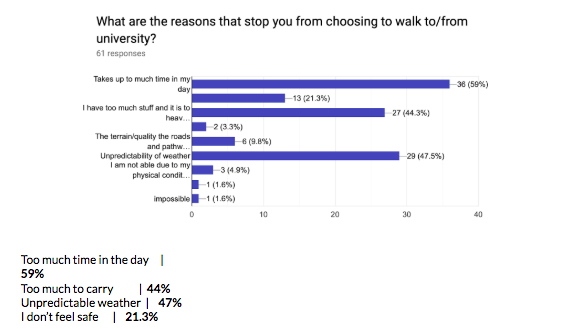
Some of the reasons that they do not walk to university are takes up to much time in my day (59%), Unpredictability of weather (47.5%), I have to much stuff and it is to heavy (44.3%).
This helps us to know what we need to tackle to motivate more people to walk. Although things like not enough time and unpredictable weather are hard to fix we could help prepare people for this.
This is from our social media part of the survey:
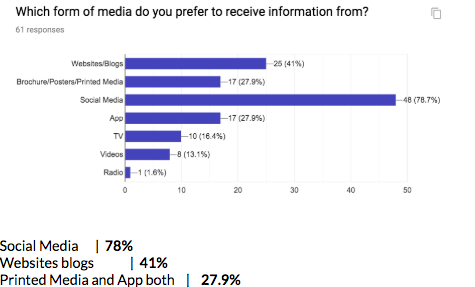
We looked into the different forms of media people use so that we know how we can target our audience.
Social media was the highest (78.7%) then websites/blogs (41%). Both an app and printed media were the third most popular (27.9%). These are the things we would look at creating to help encourage university students to walk.
In conclusion we found the survey very useful to collect quantitative data. We struggled collecting responses but we find it a valuable part of the research as this is what will help us to make decisions regarding our design.
